Correcting Some Misconceptions About A New Secular Bull Market
As I was preparing to write my annual “Outlook and Forecast” for 2014, I read many different views from major Wall Street firms to get a general feel of the consensus. However, during the course of my research I read one piece of work in particular that tried to build the case that we have entered into a new “secular” bull market as last seen in the early 1980’s. However, while the thesis is interesting, it was based on some flawed assumptions interest rates, valuations and time frames.
Interest Rates
The first assumption was that interest rates have now begun a secular shift higher based on the premise that the current pickup in rates was akin to what was last seen in 1946 as shown in the chart below.

While the chart clearly shows that interest rates have hit the same levels as last seen in 1946, the view that rates will rise strongly from current levels assumes that the same economic drivers exist today. In 1946, the United States had just exited WWII which left Europe and Japan in ruins. The United States became the manufacturing center of the industrialized world as we assisted in the rebuilding of Germany, Britain, France and Japan. That is no longer the case today as much of our industrial manufacturing has been outsourced to other countries for lower costs. The chart below shows interest rates overlaid against the annual changes in economic growth.

While there are many “hopes” that economic growth will pick up in 2014 the ongoing demand for lower prices on goods and services requires continued wage suppression through “job exportation” and lower financing costs to maintain profitability. This will likely keep a lid on interest rates for quite some time to come. Furthermore, the currently low savings rate, which reduces productive investments, combined with an aging population provides additional headwinds to the ability of interest rates to rise. This has been the ongoing problem for Japan which has seen interest rates stuck at low levels for over a decade.

While there are many arguments that we are not Japan, with which I agree, there are many similarities from an economic perspective.
Valuations
The second argument for entry into a secular bull market was based on valuations.
“The S&P 500 currently trades at 16.45x this year’s bottom up operating earnings estimate.
In their seminal book ‘Security Analysis,’ Graham & Dodd publish an equation about how to calculate a proper Price to Earnings Ratio (P/E). The formula was:
P/E = 8 + (2 x Expected Earnings Growth)
So, even if I haircut earnings growth to 4.5%, the P/E would be 17x. If next year’s earnings estimate of $122.42 is anywhere close to the mark, that would suggest a price of 2081.”
That statement should get just about everyone excited as that would imply a rise of 13% in 2014 from the current price levels.
However, there is a huge problem with this analysis. Graham & Dodd never used forward operating earnings in the analysis as such metrics were not used when they published their seminal work. Graham focused on reported trailing earnings and always suggested in using an average of earnings (using a 5,7 or 10 year time frame) to smooth out anomalies. This smoothing of earnings was the basis for Professor Robert Shiller’s work on smoothing inflation adjusted earnings using a 10-year average.
Using reported earnings for Q3-2013, which is the last fully completed quarter, and using the current price of 1841, the current P/E ratio is 19.5x earnings. (For a variety of charts on market valuations from Tobin’s Q-ratio to Shillers P/E refer to “The Market In Pictures”) From just about any historical perspective, the markets are now becoming expensive. However, if we correctly use Graham’s formula using reported earnings and the historical growth rate of earnings of 6% we get the following valuation:
P/E = 8 + (2*6) = 20x
This would imply a target of 1887 for 2014 or a return of 2.4%. Importantly, a 2.4% rate of return from such levels of high valuation would be consistent with historical norms.
However, if we use the current forward estimates for reported earnings in 2014, which currently stands at $106.00 per share, and use estimated year end reported earnings for 2013 of $96.72, then the earnings growth rate rises to 10%. Graham’s formula then changes to:
P/E = 8 + (2*10) = 28x
Such a valuation would exceed every other secular bull market valuation peak in history with the exception of the “tech bubble” in 2000 and the spike in valuations caused by the “financial crisis” as earnings collapsed in 2008. The chart below shows the historical P/E ratio using trailing reported earnings from 1900-present.

However, a P/E ratio of 28x would imply a target for the S&P 500 of 2708 which would be a 47% rise from current levels over the next 12 months. While such a price rise could conceivable occur, the likelihood of such a monstrous increase in the current environment is unlikely. The most likely outcome will either be a disappointment in earnings, prices or both.
Time Frames
Lastly, his discussion focused on time frames stating that:
“I think the odds favor that we are in a new secular bull market like the 1982-2000 affair.”
Using the following chart as evidence.
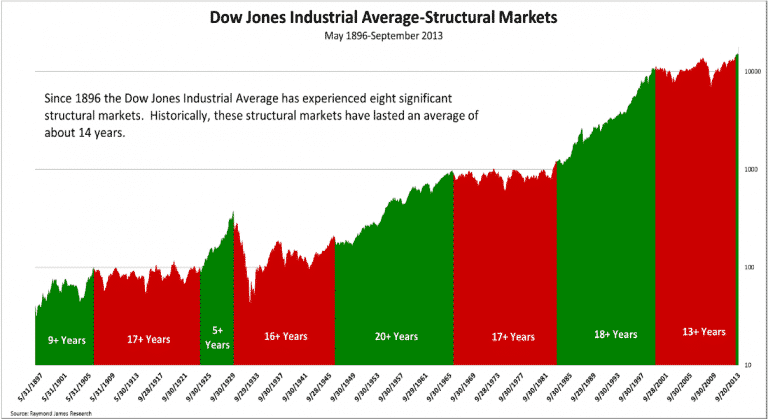
First, the chart notes that the average of each cycle has been 14 years. However, that average was skewed by the very short secular bull market of 5+ years leading up to the 1929 peak. More importantly, as noted, we are currently 13 years into a secular bear market which the average historical secular bear market has averaged 17 years. In a complete vacuum of other data, it would suggest that the current secular cycle still has roughly four more years, and one more nasty decline, to come.
Secondly, the ability to have a “1982-2000 affair” is highly improbable. The 1982-2000 secular bull market cycle was driven primarily by a multiple expansion process with a beginning valuation level of 5-7x earnings and a dividend yield of 6%. Interest rates and inflation were at extremely high levels and were at the beginning of a 30-year decline which would increase profitability as production and interest rate costs fell. Lastly, the consumer was at the beginning of a period of a leverage ramp up which spurred consumption levels to almost 70% of GDP.

With inflation and interest rates currently at low levels, and consumers already heavily levered relative to historical norms, the drivers that led to the secular bull market in of the 80-90’s simply do not exist today.
Conclusion
While being a “stark raving bull” going into 2014 is certainly fashionable currently; as investors, we should place our faith, and hard earned savings, into the reality of the underlying fundamentals. It is entirely conceivable that the current momentum driven markets, fueled by ongoing Federal Reserve interventions, could certainly drift higher in the months to come. However, the reality is that the current underlying demographic trends, economic realities and market fundamentals do not provide the base to support current price levels much less the entrance into a secular bull market akin to that of the 80’s and 90’s.
Of course, with virtual entirety of Wall Street being extremely bullish on the markets and economy going into 2014, along with bullish sentiment at extremely high levels, it certainly brings to mind Bob Farrell’s Rule #9 which states: “When all experts agree – something else is bound to happen.”
Hold on to your hats friends – 2014 could well turn out to be an interesting year for all the wrong reasons.
Comments are closed.