What the yield curve is signaling about the US economy
Today, we saw a nice pop in equities on the back of a dovish Fed and falling interest rates. Equities moved to new highs as a result. But, clearly, falling yields are a sign of economic distress that one might think would cause equity investors to run for cover. What gives?
Here’s my answer.
The Fed’s forward guidance
I am going to start with the Fed here, because that’s where a lot of this bullishness is coming from. Yesterday, the Fed delivered exactly the message markets wanted to hear and expected to hear. The Fed didn’t lower rates. But it said it was poised to do so, likely at the very next FOMC meeting in July.
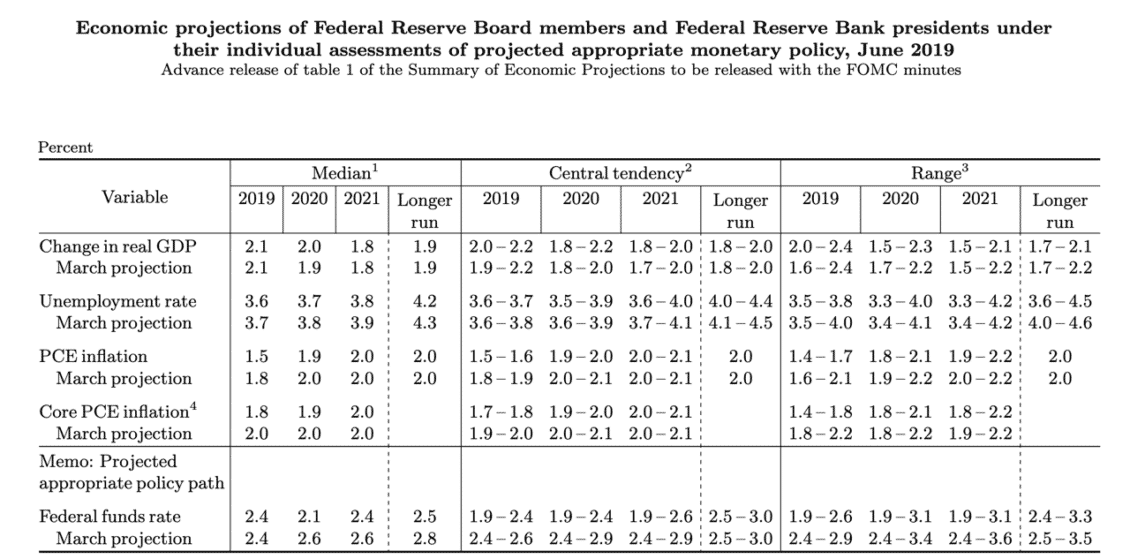
And with Fed Funds futures pricing in a 100% chance of a cut in July and 75 basis points of easing in 2019, there is an outside that we see a massive 50 basis points of cutting next month. Comments by Powell in the post-FOMC meeting press conference yesterday suggested as much. But the Dot Plot says so as well, with several members lowering their projected fed funds forecasts.
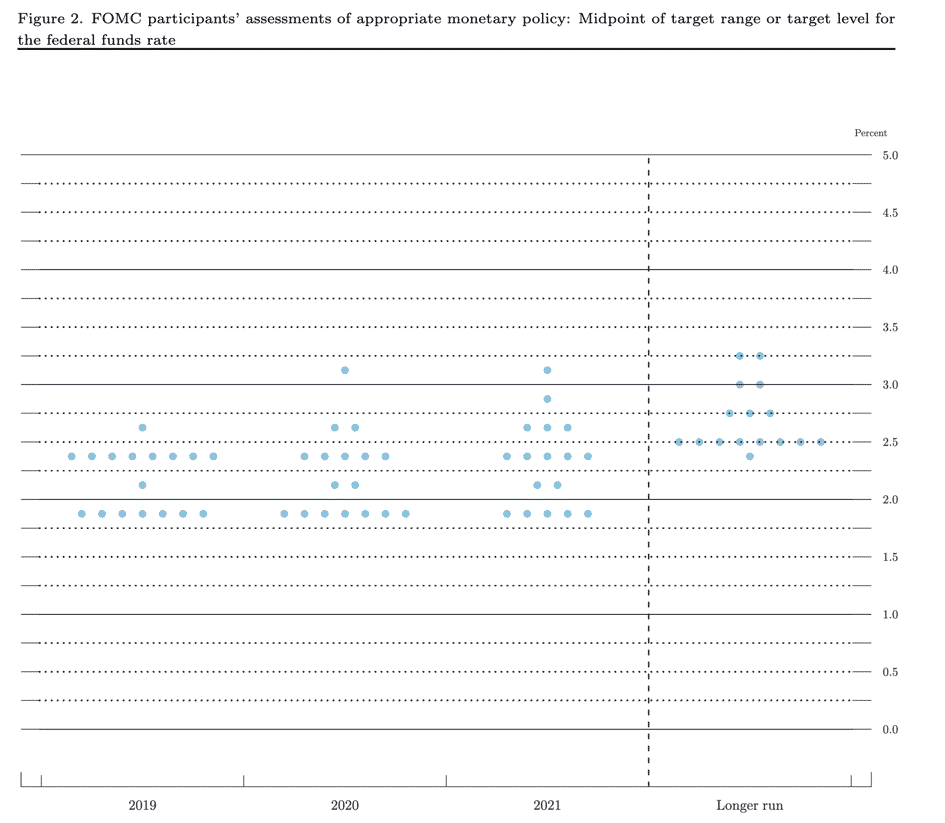
So what the Fed is essentially saying is it’s got your back. They know the economy has weakened. Their economic forecasts show this because they show less growth, lower inflation, in a forecast with lower unemployment rates.
So, they are moving aggressively to prevent a recession, one they would be  blamed for given their overtightening in 2018. And, from Powell’s language in the presser, it’s clear they have abandoned their Phillips Curve ideology and moved more to a position of wondering if they’ll ever be able to generate 2% inflation.
Bond market reaction
So, that’s bullish for bonds. And bonds rallied right across the curve, taking the 10-year under 2%. Where’s the bond bear market you promised me, Gross and Gundlach?
Nevertheless, the curve remains inverted from 3 months to 10 years, causing many to predict recession. Some people are saying we’re in a recession now.
Certainly, capital expenditure growth has peaked and the household employment survey is showing lots of weakness. PMI, business confidence and ISM data point to weakness in industrial production as well. Plus real final sales were much lower in Q1 than the headline number real GDP growth rate. And that suggests one-offs artificially bolstered the figure, with retail sales not as robust as we would like.
But none of this says recession. Year-over-year consumption growth is still looking good. Here’s the time series in nominal non-inflation-adjusted terms.
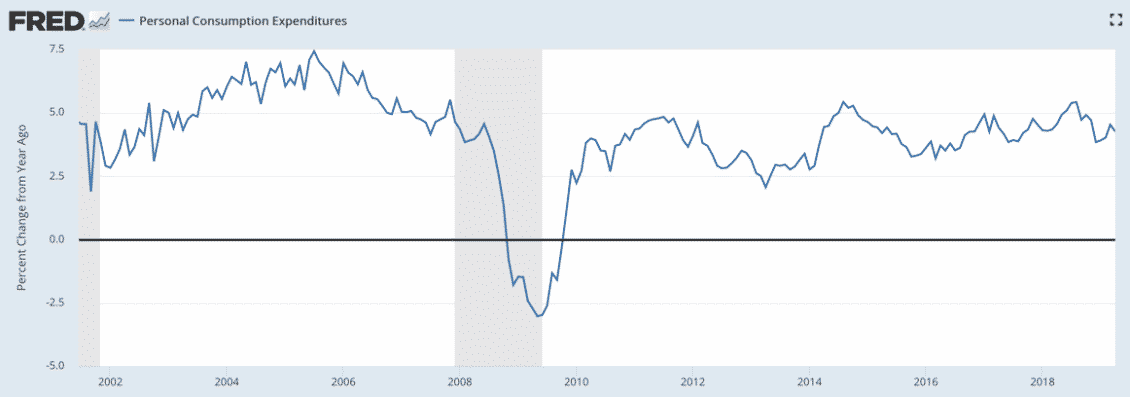
That’s not a chart screaming RECESSION – just the opposite.
Easing but not necessarily a recession
What I think is happening is the bond market is simply predicting a Fed easing and not a recession. The spread between 2-year notes and 10-year bonds has actually widened somewhat to 25 basis points steep. Earlier today, I saw it trading at 27 basis points. So, it’s not enough to just look at 3-mo to 10-year spreads as the only yield curve indicator. The 2/10 spread has never gone negative in this business cycle. And it’s wider now than it was during the inversion scare in 2018.
For reference, here’s what that spread has looked like over the past few business cycles.

This is an indicator that has always been on the money with no false positives – meaning the spread always turns negative before the recession and there has never been a post WW2 recession without the curve inverting from 2 to 10 years.
I believe we are not seeing inversion here because the market doesn’t yet fully believe in recession. The concentration of anticipated cutting shows up in the 3-month to 3-year realm, with inversion very pronounced – at market close, 41.6 basis points. But beyond 3 years, you get a huge steepening out to 30, with 3’s trading 30 basis points inside of 10’s and 81 basis points inside of 30’s.
The 3-year to 10-year steepening is indicative of a resumption of policy normalcy. It’s saying either you have rate cuts in the near term and then a short, shallow recession followed by normalcy or none at all. The precedents are 1994 and 2001.
Bottom line: Without a 2-10 inversion, I remain skeptical of “the recession is imminent” calls.
That means equities can rally. And they can remain elevated until the economic weakness in the real economy becomes acute enough to dent earnings growth expectations. We’re not there quite yet.
Comments are closed.