Producer price inflation down 2.8%, but core up 0.4%
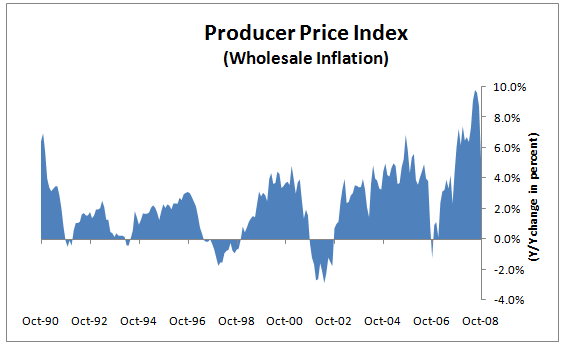
The headline story is that this is the largest month-to-month fall ever since monthly statistics began for this data series in 1947. But, as you can see from the chart below, all of this decline was due to food and energy. Therefore, the massive fall in oil prices was responsible for the drop and the PPI year-on-year is still over 5%.
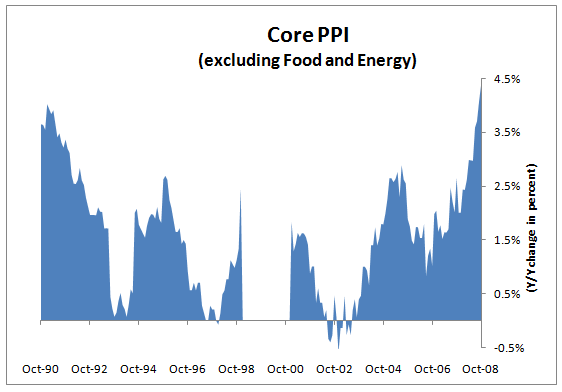
Moreover, the rise in the core inflation number was higher than expected with a 0.4% month-to-month increase. This does not show that inflation is completely tamed.
Nevertheless, market participants are sure to use this as an excuse to play up deflation. While I agree that deflation is a very serious threat, this report should not be used to make that argument.
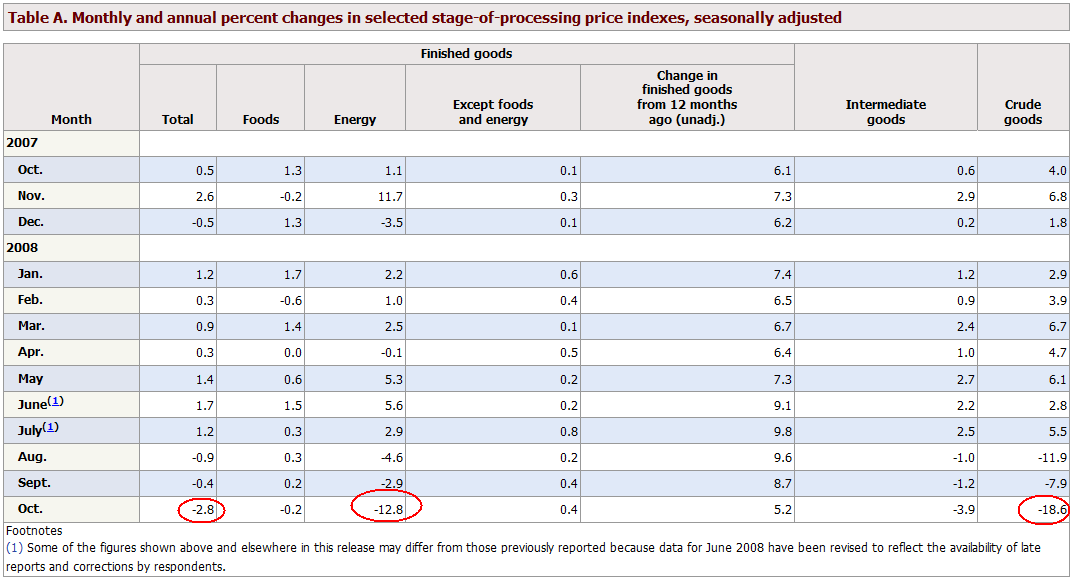
Having looked at the numbers, I see that annual producer price inflation is coming down substantially. Non-seasonally adjusted PPI reached a 27-year high in July of 9.8%, but has plummeted to 5.2%. But, all of this decline was due to the decline in oil prices. Core inflation is actually rising. In July 2006 it was at a low of 0.8%. SInce then it has risen to 4.4%. That is a fairly steep rise in the underlying rate f inflation.
Deflation is certainly something to be concerned about because of falling asset prices supporting large levels of debt. But deflation will be caused by asset price falls if it occurs. If you read in the newspaper tomorrow that the PPI went down the most ever and that shows deflation has arrived, you will know this is not the case.
Source
Producer Price Index – Bureau of Labor Statistics
Comments are closed.