Chart of the day: Japan 1984-2004
Japan suffered one of the most horrific market meltdowns in history from 1984-2004. Only four years after the last market bottom and on the verge of another global market downturn, it even may be too early to use the past tense to describe the bubble.
Yet, Japan offers a remarkable lesson regarding easy money and its affect on asset prices. These graphs are a sobering reminder that prudent monetary and regulatory policies are the correct prevention for asset market busts.
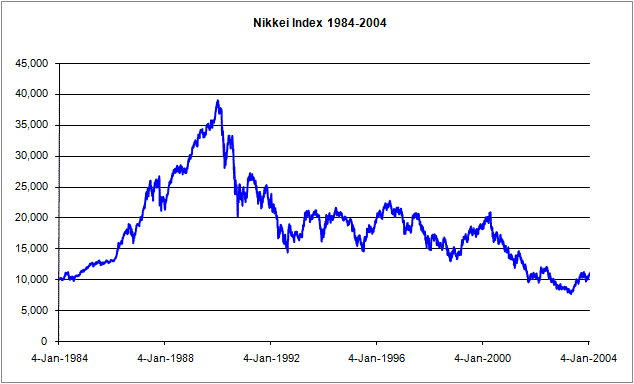
The charts show the market taking off from 1984-1987 when Japan suffered a major decline of 20% in the crash. The markets soon recovered due to an ultra easy money policy by the Bank of Japan and it was off to the races. When the Nikkei reached the top of 38, 916 at the end of the decade, the 5-year return was a massive 237%.
At that point the bottom dropped out through to the beginning of the property crash in 1992. Temporarily, the damage in the stock market was over. A false bottom held for six full years as the Nikkei oscillated between roughly 15,000 and 21,000 despite a massive earthquake in Kobe and a Sarin gas attack in 1995 and the eventual onset of deflation.
When the collapse of the Thai Baht in May 1997 precipitated the Asian crisis, it led to a depression in Asia and to other emerging market turmoil. The Russians devalued and defaulted and Long-Term Capital caused a panic in 1998. Japan breached its previous 1995 low but pulled out for a last bear market rally through to the end of the tech bubble.
That’s when the bottom really fell out for Japan: a massive 63% loss from April 2000 to the eventual bottom in May 2003, a full 14 years after the market had peaked.
The moral of the Japanese adventure is this: purging the bad debt, shutting down bankrupt financial institutions and liquidating zombie companies is painful but necessary. Attempts to prop up the economy falsely with Keynesian proposals, piling on massive government debt as Bill Gross proposes is a recipe for disaster.
Update – 2009 01 16: you should note that I would qualify this statement more now. While I do not believe stimulus is the answer and the answer is very much liquidating bankrupt, zombie enterprises, I do believe that stimulus will be necessary to prevent an entire collapse of the banking system. Therefore, you could say my position has changed from one of ideological opposition to stimulus to one of practical acceptance of a necessary evil.


Nice post – scary graphs, especially if I try to overlay US market graphs and draw an analogy…
Everyone thinks that what happened to Japan could never happen to the U.S. I think that in 10 year the S&P 500 will not be above 1500. That will be 20 years of no gains, just like China.
Marcus, I just might try the overlay. I have seen the overlay for the NASDAQ circa 1998-2003 and it is reminiscent in a scary sort of way.
What I find a bit off-putting is the 14 years it took for Japan to hit rock bottom. We say it can’t happen here but policy makers are making many of the same decisions as the Japanese.