Jobless claims rise slightly, weakness remains
Initial Jobless claims rose in the latest week to 627,000 from a revised 612,000. Continuing claims also rose to 6,738,000, demonstrating that the job market in the U.S. remains weak. Now, back in April and May, I made a big to-do about the fact that most indications suggested that jobless claims were peaking. In retrospect, this does seem to be the case. So now, I would like to turn my focus in on the pace of improvement.
The pace is slow. For example, this last week’s data show the painful saw-tooth pattern in the recent drop in unemployment claims. There is no reverse V-shape to the claims figures that has characterized past economic recoveries. Moreover, there are fewer reliable data points in the series. We should start to discount continuing claims as a good metric because clearly people are falling off the unemployment roles before they find work. This makes continuing claims a less meaningful number. So, that leaves us with initial claims i.e. how many people are being laid off (note: this may not include a lot of workers laid off from small businesses and ineligible for unemployment insurance).
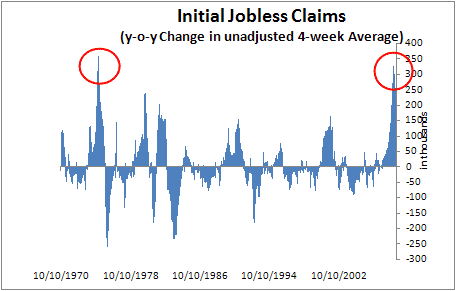
Here is what the year-over-year change in jobless claims looks like:
The peak in the change in initial claims is most similar to the 1975 peak almost 35 years ago. Back then, we peaked at 361,000 in Feb 1975. By July, we were in the 140K range. By November, the year-on-year data comparisons were negative. The recession was technically over in March 1975, a perfect example of how unemployment is a lagging indicator but the change in initial claims is not.
This go around, the peak change was 327,000 way back in January, meaning that December and January were the worst period of this downturn. Fast forward five months as I did in 1975 and you see we are still 206,000 above last year’s numbers. So, initial jobless claims have dipped 121K in 5 months, whereas in 1975, the dip was 220K, almost twice as fast a decline. What does that tell you?
Clearly, this is a weak recovery. But, when it comes to jobless claims, it is the weakest recovery on record. Perhaps in the coming weeks, I can document this more precisely. However, my conclusion at this stage is that despite an imminent recovery signal from the data set, recovery will be delayed and it will be slow take take hold. This is something I have said often and these data support that conclusion.
I should note that in 1975, the recession ended when initial claims were running at an average 314,000 clip. I have indexed this at 523,000 using the change in covered employment and 1990 as a base year. As covered employment is 28% higher today than it was in 1990, the equivalent number today is about 670,000. We are well under that level of course, so a recession can easily end technically with claims running at 550K or 600K.
The final GDP number for Q1 came out this morning at 5.5% down from Q4 2008 on an annualized basis. Expect Q2 to be much better than this. By the end of Q3, we could see jobless claims at a 550,000 level and we may flirt with positive territory on GDP. This is why I see a technical recovery by Q4 or Q1 2010 despite what looks to be a weak employment market.

I have some difficulty understanding what sector the recovery will be coming from. Absent consumer credit growth or wage/employment increases, this sector can not lead a recovery. (Joseph Ellis and Ray Dalio have both noted this.) Residential investment is not going to lead us out anytime soon. Capex seems likely to remain low in the face of excess capacity and stagnant demand. Inventory rebuilding seems unlikely to be sustained if consumers remain in deleveraging mode. And we aren’t going to be exporting our way out of it.
So this leaves the government. Yes, the bulk of the stimulus hits next year, and monetary policy is very stimulative. Are you expecting technical growth to be caused by a bottoming of the decline in the private sector combined with an increase in government spending?
How do credit writedowns factor into your view? I see many, many more coming.