Chart of the day: Change in jobless claims
Every week the U.S. Department of Labor puts out the previous week’s jobless claims statistics through its Employment and Training Administration (Doleta). Analysts look at it to get a sense of how employment is being affected by the underlying economy in order to predict what consumer spending will be like down the road. The media blindly states the number of initial claims and continuing claims in comparison to the previous week — as if that means something. I have a few problems with this approach.
- There are all sorts of week-to-week fluctuations due to one-off events like strikes or mass layoffs. So, I look at the 4-week average number which the Doleta also publishes to eliminate this effect.
- Week to week comparisons are meaningless. Anything can happen in that short a space of time, even when using 4-week average numbers. Therefore, I make year-over-year (y-o-y) comparisons. That way I can see the same stat at same time of year.
- The number is ‘seasonally-adjusted’ and isn’t the actual number of layoffs. Anyone who scrutinizes government statistics has got to be worried about the accuracy of seasonal adjustment factors (which are determined one year in advance). Therefore, I use the raw numbers instead.
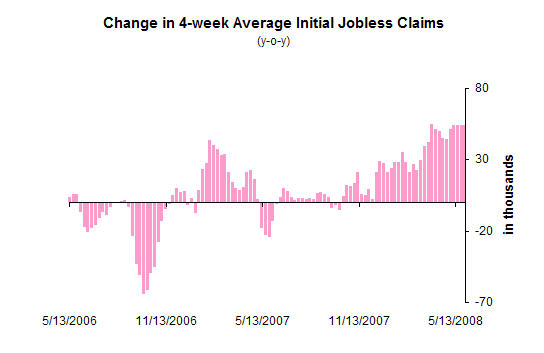
So what I am left with is a comparison of the 4-week average number of people filing for unemployment across the U.S. compared to one year ago. More people filing for unemployment insurance is bad; fewer people is good.
I have looked at this number for a number of years now (using data back to 1967). My rule of thumb is: when this year’s claims number is more than 50,000 above last year’s for more than a few weeks, one should be worried. So far, this has been the case for five weeks running.
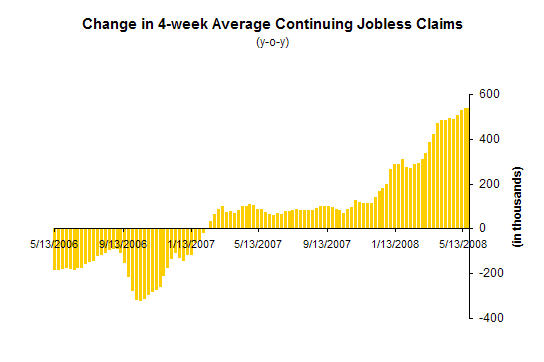
I do the same exercise for continuing claims (the number of people receiving unemployment compensation at any one time). Here, my rule of thumb has been that a rise of 200,000 more people on unemployment over a year is worrying. This has been the case for 11 weeks and we have now hit a rise of over 530,000.
Every time both of these numbers (up 50,000 for y-o-y initial claims and up 200,000 for y-o-y continuing claims) held for more than 5 weeks we have had a recession. And there have been absolutely no false positives in 40 years. None.
Should we be worried yet?
Yes.
Recommended related reading
Ahead of the Curve by Joseph Ellis (Great book)


Comments are closed.